
Kratom Strain Chart: Colors — Effects Reported — and How to Read One
A kratom strain chart maps the market's naming system: vein color across the top, region and character notes below. It is a useful reference and a misleading one at the same time. Useful, because the color-to-drying relationship is real. Misleading, because no standards body enforces what any chart claims. The single most important thing to know before you read any strain chart: the character notes describe what users report, not proven effects. Use the chart as a vocabulary guide, not a promise sheet.
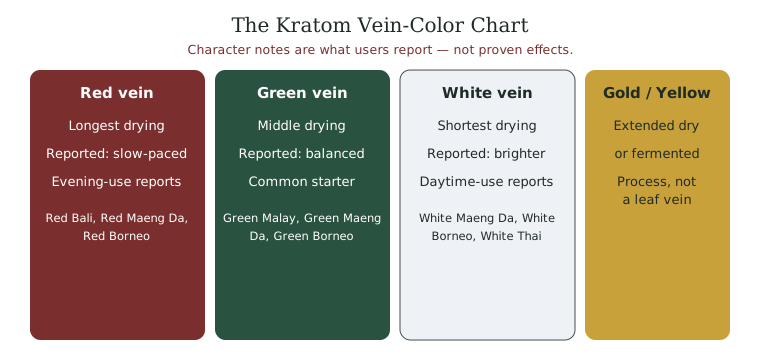
How to Read a Strain Chart
Read every chart in two columns of meaning. The first column is fact: vein color reflects how the leaf was dried. Red vein gets the longest drying, white the shortest, green the middle path. The second column is report: the "energizing" or "relaxing" labels attached to each color come from user surveys, not laboratory proof. Keep those two columns separate in your mind, and no chart can oversell you. The fact column helps you shop. The report column is context, nothing more.
Why Charts Mislead
Charts imply a precision the plant does not have. Two products labeled "Green Malay" can differ more than a red and a white from the same careful vendor, because drying and source vary. The research supports this caution. In a 2019 study in Substance Use and Misuse, Darshan Singh and colleagues tested whether kratom produced reliably different effects by amount and found no statistically significant serving-to-effect signal in their sample (Singh et al., 2019). If amount did not map cleanly to effect, a color label on a chart maps even less cleanly. The chart is a starting vocabulary, and the certificate of analysis is the real spec.
The Colors, Briefly
Four color groups cover the whole chart, and each has a full guide:
- The red vein kratom guide covers the longest-dried family and its roster.
- The green vein kratom guide covers the middle path most new consumers start with.
- The white vein kratom guide covers early-harvest, short-dried leaf.
- yellow kratom explained covers the fermentation-and-drying story behind yellow and gold.
Reading the Chart the Smart Way
Turn the chart into a shopping tool with three habits. First, pick a vein color as a rough starting point, using the honest side-by-side in red vs green vs white compared. Secondly, ignore superlatives — "premium," "ultra," "royal" describe nothing a lab can measure. Thirdly, demand the certificate of analysis and read the mitragynine percentage, because that number is the only cell on any chart that cannot be invented. A chart narrows your choice. A lab result confirms it.
Turning a Chart Into a Purchase
The practical value of a strain chart is as a starting filter, and the workflow is short. Begin by narrowing to a vein color that fits when you plan to use kratom, using the reported character as a rough guide rather than a promise. Next, pick a region style you are curious about, knowing it is vocabulary more than confirmed origin. Then leave the chart behind and pull up the specific product's certificate of analysis. Read the mitragynine percentage, confirm the lot number, and check the contaminant screens. That is the whole journey from chart to cart. The chart narrows fifty options to a few. The lab result turns those few into a confident, verified choice. Anyone who follows that sequence buys on evidence instead of on names, which is the entire habit this resource is built to teach.
How Vendors Build Their Charts
It helps to know how a strain chart gets made in the first place. Vendors assemble charts from a mix of tradition, customer feedback, and marketing goals. The color-to-drying facts are inherited from real kratom processing. The character notes are aggregated from what customers report and from what sells. The region labels follow supply-chain naming conventions. None of this is validated by an independent standards body, because none exists for kratom. So a chart is best understood as a vendor's organized sales vocabulary, not a scientific reference. That does not make it useless. It makes it something to read critically rather than trust blindly.
Region Names on the Chart
Charts add a second axis beyond color: region. Bali, Borneo, Malay, Thai, Sumatra, and others appear as columns or rows. Read these region names with the same skepticism as the color labels. Most commercial kratom grows in Indonesian Borneo regardless of the name printed on the bag, because Indonesia dominates export volume. Thailand banned kratom cultivation for decades, so most "Thai" kratom is Indonesian stock wearing a style name. A region name on a chart tells you what the vendor is calling the product, not always where the leaf grew. Use the region column as flavor vocabulary, and let the certificate of analysis carry the facts.
The Alkaloid Column Charts Rarely Show
The most useful column is the one most charts leave out: measured mitragynine percentage. That single number is the closest thing to an objective spec kratom has. A chart can list twenty strain names and forty character notes, and none of them will tell you as much as one lab-verified alkaloid figure. This is why the smartest way to use any strain chart is as a first filter only. Narrow to a color, narrow to a region style you prefer, then throw the chart away and read the lab result on the specific product in front of you. The chart orients. The lab result decides. That order protects both your money and your expectations, and it is the habit this entire site is built to teach.
Where the Chart Sends You Next
Use the chart as a map into the strain guides, not as a destination. Once a color interests you, read that vein's guide, then the specific strain page, then verify the product. Browse the full set in types of kratom, and ground the whole system in what kratom is if the vocabulary is still new. The chart's job is to orient you. The evidence pages do the real work of protecting your money and your expectations.
Frequently Asked Questions
What does a kratom strain chart show?
It maps vein color (red, green, white, gold) to region names and reported character. The color reflects drying method, which is factual. The character notes are user reports, not proven effects.
Are the effects on a strain chart proven?
No. The energizing or relaxing labels come from user surveys, not controlled trials. A 2019 study found no statistically significant serving-to-effect signal, so read chart labels as vocabulary, not promises.
What is the most reliable part of any strain product?
The certificate of analysis. The mitragynine percentage it reports is the one specification a vendor cannot invent, unlike strain names and superlatives.